MAY KEY FIGURES
 |  | May 12 | Apr 12 to May 12 | May 11 to May 12 |
 |  | no. | % change | % change |
|
| TREND |  |  |  |
 | Total dwelling units approved | 12 066 | 1.6 | -6.5 |
 | Private sector houses | 7 088 | -1.2 | -9.7 |
 | Private sector dwellings excluding houses | 4 850 | 6.3 | 3.4 |
| SEASONALLY ADJUSTED |  |  |  |
 | Total dwelling units approved | 13 591 | 27.3 | 9.3 |
 | Private sector houses | 7 256 | 8.7 | -7.7 |
 | Private sector dwellings excluding houses | 6 197 | 58.7 | 45.4 |
|
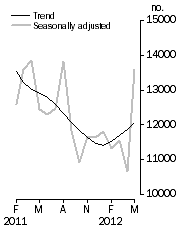
Dwelling units approved

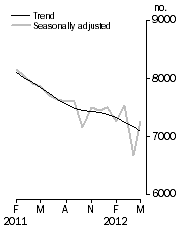
| Private sector houses approved

|
MAY KEY POINTS
TOTAL DWELLING UNITS
- The trend estimate for total dwellings approved rose 1.6% in May and has risen for 4 months.
- The seasonally adjusted estimate for total dwellings approved rose 27.3% in May following a fall of 7.6% in the previous month.
PRIVATE SECTOR HOUSES
- The trend estimate for private sector houses approved fell 1.2% in May and has fallen for 29 months.
- The seasonally adjusted estimate for private sector houses rose 8.7% in May following a fall of 11.4% in the previous month.
PRIVATE SECTOR DWELLINGS EXCLUDING HOUSES
- The trend estimate for private sector dwellings excluding houses rose 6.3% in May and has risen for 5 months.
- The seasonally adjusted estimate for private sector dwellings excluding houses rose 58.7% in May and has risen for 2 months.
VALUE OF BUILDING APPROVED
- The trend estimate of the value of total building approved rose 3.4% in May and has risen for 4 months. The value of residential building rose 2.1% and has risen for 5 months. The value of non-residential building rose 5.3% and has risen for 4 months.
- The seasonally adjusted estimate of the value of total building approved rose 43.4% in May after falling for 3 months. The value of residential building rose 26.8% after falling for 2 months. The value of non-residential building rose 71.0% and has risen for 2 months.
NOTES
FORTHCOMING ISSUES
| ISSUE | Release Date |
| May 2012 (Additional Information) | 10 July 2012 |
| June 2012 | 31 July 2012 |
| June 2012 (Additional Information) | 7 August 2012 |
| July 2012 | 30 August 2012 |
| July 2012 (Additional Information) | 7 September 2012 |
| August 2012 | 4 October 2012 |
| August 2012 (Additional Information) | 11 October 2012 |
| September 2012 | 31 October 2012 |
CHANGES IN THIS ISSUE
There are no changes in this issue.
DATA NOTES
The statistics for Western Australia in recent months may have been impacted by the WA Building Act 2011 which came into effect on 2 April 2012. The statistics for Northern Territory have been significantly revised due to the late provision of some approval records.
The large increase in Dwelling Unit approvals in May 2012 was driven by a number of large private sector projects in New South Wales, Victoria, and the Australian Capital Territory.
Since July 2011, Building Approval statistics have been produced using the Australian Statistical Geography Standard (ASGS) , as well as the Australian Standard Geographical Classification (ASGC). From the July 2012 issue, Building Approvals data will no longer be available on an ASGC basis. This change will only affect statistics below the State/Territory level. Statistical Local Area data will be discontinued, however Local Government Area data will be available on the ABS Building Approvals web pages, under the Downloads tab. For further information, please refer to the
Feature Article in the April 2011 issue.
REVISIONS THIS MONTH
Revisions to the total number of dwelling units approved in this issue are:
 | 2010-11 | 2011-12 | TOTAL |
|
| NSW | - | - | - |
| Vic. | - | 694 | 694 |
| Qld | - | 72 | 72 |
| SA | - | - | - |
| WA | - | 1 | 1 |
| Tas. | - | - | - |
| NT | - | 199 | 199 |
| ACT | - | - | - |
| Total | - | 966 | 966 |
|
INQUIRIES
For further information about these and related statistics, contact the National Information and Referral Service on 1300 135 070.
 Quality Declaration
  Print Page
 Print All